
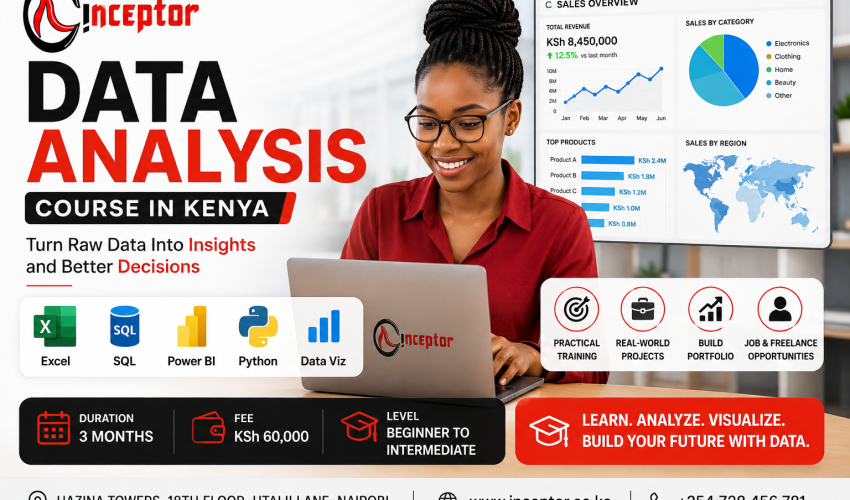
Data Analysis Course in Kenya – Excel, SQL, Power BI, Python & AI Training
Become a Job-Ready Data Analyst with Practical Data Skills
Learn how to turn raw data into useful insights, dashboards, reports and business decisions with practical Data Analysis Training at Inceptor Institute of Technology in Nairobi, Kenya.
This 3-month Data Analysis Course is designed for beginners, university and college students, graduates, professionals, researchers, entrepreneurs and career changers who want practical skills they can use in employment, business, freelancing and remote work.
You will learn how to work with real datasets using some of the most important tools used in modern data analysis:
Microsoft Excel • SQL • Power BI • Python • Statistics • Data Visualization • AI Tools
Rather than concentrating only on theory, the training takes you through the practical data analysis workflow:
Business Question → Collect Data → Clean Data → Analyse → Visualize → Interpret → Present Insights → Recommend Action
Course at a Glance
- Duration: 3 Months
- Training Fee: KSh 60,000
- Mode: Physical Classes in Nairobi & Online Training
- Level: Beginner to Intermediate
- Intakes: Ongoing
- Training Model: Practical, Instructor-Led & Project-Based
- Class Options: Morning, Afternoon, Evening & Weekend Classes

What Is Data Analysis?
Data analysis is the process of collecting, cleaning, organising, examining and interpreting data to answer questions and support better decisions.
For example, imagine a supermarket with thousands of transactions.
Management might want to know:
- Which products generate the highest revenue?
- Which products are declining in sales?
- Which branches perform best?
- Which days have the highest sales?
- Who are the most valuable customers?
- Which products are frequently purchased together?
- How is monthly revenue changing?
A data analyst can take the company’s raw sales records, clean the data using Excel or Python, retrieve information using SQL and create a Power BI dashboard that allows management to understand what is happening.
That ability to transform raw data into useful decisions is at the heart of data analysis.
Why Learn Data Analysis in Kenya?
Businesses and organisations are generating increasing amounts of data from websites, mobile applications, sales systems, accounting software, social media, customer databases, surveys and digital transactions.
The challenge is no longer simply collecting information.
Organisations need people who can answer:
What happened? Why did it happen? What does the data tell us? What should we do next?
Data analysis skills can therefore be applied in many sectors, including:
- Banking and financial services
- Telecommunications
- Retail and supermarkets
- E-commerce
- Government
- NGOs
- Healthcare
- Education
- Agriculture
- Logistics
- Insurance
- Marketing
- Human resources
- Research
- Monitoring and Evaluation
- Technology companies
This makes data analysis a versatile digital skill for learners seeking employment, career advancement or independent income opportunities.
What You Will Learn in the Data Analysis Course
Module 1: Introduction to Data Analysis
Build a strong understanding of how professional data analysis works.
You will learn:
- What is data analysis?
- Data analysis vs data analytics vs data science
- Roles and responsibilities of a data analyst
- Types of data
- Structured vs unstructured data
- Data collection methods
- Data quality
- Data cleaning
- Exploratory Data Analysis
- Descriptive and diagnostic analysis
- Understanding business questions
- Data ethics and privacy
- Turning problems into analytical questions
Practical Exercise
You will receive a business dataset and identify the questions that should be answered before beginning the analysis.
Module 2: Excel for Data Analysis
Microsoft Excel remains one of the most useful tools for analysing business and organisational data.
You will learn how to use Excel for:
- Data entry and organisation
- Data cleaning
- Sorting and filtering
- IF functions
- SUMIF/SUMIFS
- COUNTIF/COUNTIFS
- XLOOKUP and VLOOKUP
- Text and date functions
- Conditional formatting
- Data validation
- PivotTables
- PivotCharts
- Power Query fundamentals
- Charts and graphs
- KPI reporting
- Interactive dashboards
Practical Project: Sales Analysis Dashboard
You may receive a raw sales dataset containing thousands of transactions.
Your task will be to clean and analyse the information and create a dashboard showing:
Revenue | Sales Trends | Top Products | Customers | Regions | Monthly Performance
This becomes one of your first portfolio projects.
Module 3: SQL for Data Analysis
Most organisations store information in databases.
SQL — Structured Query Language — enables analysts to retrieve and analyse this information.
You will learn:
- Database fundamentals
- Tables, rows and columns
- SELECT statements
- WHERE
- ORDER BY
- GROUP BY
- Aggregate functions
- COUNT, SUM and AVG
- JOINs
- CASE statements
- Subqueries
- Common Table Expressions
- Data filtering
- SQL data cleaning
- Business reporting queries
Practical Project: E-Commerce Data Analysis
Use an e-commerce database to answer questions such as:
- Who are the highest-value customers?
- What are the best-selling products?
- What is the monthly revenue trend?
- Which categories perform poorly?
- How many customers make repeat purchases?
This helps you understand how SQL is used in real business environments.
Module 4: Power BI & Dashboard Development
Businesses do not want to spend hours reading thousands of spreadsheet rows.
They want information they can understand quickly.
Power BI allows analysts to transform data into interactive reports and management dashboards.
You will learn:
- Introduction to Microsoft Power BI
- Importing Excel and CSV data
- Connecting data sources
- Power Query
- Data transformation
- Data modelling
- Relationships
- DAX fundamentals
- Measures
- Calculated columns
- KPIs
- Charts and visualizations
- Filters and slicers
- Interactive dashboards
- Dashboard design principles
- Data storytelling
Practical Project: Business Performance Dashboard
Build an interactive Power BI dashboard showing:
Revenue → Customers → Products → Regions → Sales Trends → KPIs
The project can be included in your professional data analysis portfolio.
Module 5: Python for Data Analysis
Python allows analysts to automate analysis and work efficiently with larger or more complicated datasets.
The course introduces Python specifically from a data analyst’s perspective.
You will learn:
- Python fundamentals
- Variables and data types
- Lists and dictionaries
- Functions
- Jupyter Notebook
- NumPy fundamentals
- Pandas
- DataFrames
- Importing CSV and Excel files
- Handling missing values
- Removing duplicates
- Filtering data
- Grouping and aggregation
- Data transformation
- Exploratory Data Analysis
- Matplotlib
- Automating repetitive analytical tasks
Practical Project
Use Python to clean and analyse a real-world dataset and generate useful findings.
Module 6: Statistics for Data Analysis
You do not need to become a mathematician to become a data analyst.
However, you need to understand what the numbers mean.
Learn practical concepts including:
- Mean, median and mode
- Percentages and ratios
- Variance
- Standard deviation
- Distributions
- Correlation
- Probability fundamentals
- Sampling
- Outliers
- Trend analysis
- Hypothesis testing fundamentals
- Linear regression fundamentals
- Basic forecasting
- Interpreting statistical results
The focus is on applying statistics to practical problems, rather than memorising mathematical formulas.
Module 7: Data Visualization & Storytelling
Good analysis is not enough.
A professional analyst must be able to communicate findings clearly.
You will learn:
- Choosing the correct visualization
- Bar charts
- Line charts
- Scatter plots
- Histograms
- KPI cards
- Dashboard layouts
- Avoiding misleading visualizations
- Presenting findings to management
- Writing analytical summaries
- Data storytelling
- Turning analysis into recommendations
The objective is to move from:
“Here are the numbers.”
to:
“Here is what the numbers mean and what the organisation should consider doing.”
Module 8: AI for Data Analysis
Artificial Intelligence is changing how analysts work.
Modern data analysts should understand both traditional analytical techniques and how to use AI responsibly to improve productivity.
You will explore how AI tools can assist with:
- Generating Excel formulas
- Explaining complicated formulas
- Writing SQL queries
- Debugging SQL
- Generating Python code
- Explaining Python errors
- Exploring datasets
- Identifying possible patterns
- Suggesting visualizations
- Summarising analytical findings
- Drafting reports
- Creating executive summaries
- Automating repetitive analytical workflows
Example AI-Assisted Workflow
Raw Dataset → AI-Assisted Exploration → Data Cleaning → Excel/SQL/Python Analysis → Power BI Visualization → Interpretation → Business Recommendation
You will also learn an important professional principle:
Never blindly trust AI-generated analysis.
A data analyst must verify calculations, assumptions, queries, outputs and conclusions before using them for decision-making.
Module 9: Real-World Business Data Analysis
Knowing software is only part of becoming a data analyst.
You also need to understand the business problem behind the data.
Learners will work on practical scenarios involving areas such as:
Sales Analytics
Analyse products, customers, revenue, salespeople and regions.
Marketing Analytics
Evaluate campaigns, leads, conversions and customer acquisition.
Financial Analysis
Analyse revenue, expenses, budgets and profitability.
HR Analytics
Analyse employee turnover, absenteeism, demographics and performance.
NGO & Monitoring and Evaluation Data
Analyse survey, program and beneficiary data and prepare reports.
E-Commerce Analytics
Analyse products, orders, customers, revenue and purchasing behaviour.
Education Analytics
Analyse student performance, attendance and academic trends.
Module 10: Portfolio, Career & Freelancing Preparation
One of the biggest questions learners ask is:
“How do I get a data analyst job without experience?”
A certificate is useful, but employers and clients also want evidence that you can work with data.
You will therefore learn how to:
- Build a data analysis portfolio
- Document your projects
- Present Power BI dashboards
- Create data analysis case studies
- Prepare a data analyst CV
- Optimise your LinkedIn profile
- Prepare for common interview questions
- Approach internship opportunities
- Search for junior data analyst jobs
- Identify remote data analysis opportunities
- Package freelance services
- Present analytical solutions to potential clients
Data Analysis Projects You Can Add to Your Portfolio
By the end of the training, learners should aim to have practical projects demonstrating their abilities.
Examples include:
1. Sales Analytics Dashboard
Analyse revenue, products, customers and regions using Excel or Power BI.
2. E-Commerce SQL Analysis
Analyse orders, customers, products and revenue using SQL.
3. HR Analytics Dashboard
Analyse workforce data including turnover, demographics and absenteeism.
4. Marketing Campaign Analysis
Determine which campaigns or channels generated the best results.
5. Financial Performance Dashboard
Track revenue, expenses, profitability and business performance.
6. Python Data Analysis Project
Clean and analyse a dataset using Python and Pandas.
These projects can be used to demonstrate your skills when applying for employment, internships or freelance work.
What Jobs Can You Get After a Data Analysis Course?
Data analysis skills can support career paths such as:
- Data Analyst
- Junior Data Analyst
- Business Intelligence Analyst
- Reporting Analyst
- Business Analyst
- Research Analyst
- Marketing Analyst
- Sales Analyst
- Operations Analyst
- Financial Analyst
- Monitoring & Evaluation Data Analyst
- Power BI Analyst
- Data Visualization Specialist
- Data Reporting Officer
- Analytics Consultant
Employment depends on factors including your experience, education, portfolio, technical competence and the requirements of individual employers.
Can You Make Money Online with Data Analysis Skills?
Yes. Data analysis is also a service-based digital skill that can be offered to businesses and clients online.
Instead of only searching for permanent employment, competent analysts can offer services such as:
- Excel data cleaning
- Spreadsheet analysis
- Power BI dashboard creation
- SQL reporting
- Survey data analysis
- Business reporting
- Data visualization
- KPI dashboard development
- Market research analysis
- Python data analysis
- Automated Excel reports
- Financial dashboard development
Example
Imagine a small business has three years of sales records stored in Excel but the owner cannot easily understand the information.
You could offer to:
Clean the data → analyse sales → identify trends → create a Power BI dashboard → prepare a management summary.
Instead of selling yourself simply as a “data analyst,” you can package the result:
“I will analyse your business sales data and build an interactive Power BI dashboard.”
Clients understand outcomes more easily than technical jargon.
Where Can Data Analysts Find Freelance and Remote Work?
After developing sufficient competence and a strong portfolio, analysts can explore:
- Freelance marketplaces
- Remote job platforms
- Direct outreach to businesses
- SMEs
- NGOs and research organisations
- Consultants
- Startups
- E-commerce businesses
- Accounting firms
- Marketing agencies
You can also approach businesses directly with specific solutions such as dashboard development, Excel automation or monthly reporting.
Turn Your Data Analysis Skills into Digital Products
Data analysis knowledge can also be packaged into reusable digital resources.
After becoming proficient in a particular area, you could create:
- Excel budget templates
- Sales dashboard templates
- Inventory trackers
- KPI dashboard templates
- Financial reporting spreadsheets
- Power BI templates
- Data cleaning checklists
- Beginner Excel tutorials
- SQL practice exercises
- Data analysis ebooks
- Short video tutorials
- Data analysis micro-courses
This provides another potential way of monetising specialised knowledge beyond employment and freelance services.
Who Should Take This Data Analysis Course?
The course is suitable for:
- KCSE graduates interested in digital careers
- University and college students
- Recent graduates
- Professionals seeking additional digital skills
- Accountants
- Finance professionals
- Researchers
- NGO professionals
- Monitoring & Evaluation professionals
- Marketing professionals
- HR professionals
- Business owners
- Entrepreneurs
- Career changers
- Anyone interested in learning how to work with data
Can a Beginner Learn Data Analysis?
Yes.
You do not need to be a programmer before joining.
The course starts with data analysis fundamentals and familiar tools such as Excel before progressing to SQL, Power BI, Python and AI-assisted analytics.
A typical learning progression is:
Excel → SQL → Power BI → Python → Statistics → AI → Projects → Portfolio
The objective is to build your abilities progressively rather than overwhelming you with advanced programming at the beginning.
Data Analysis vs Data Analytics vs Data Science
These terms are related but not identical.
Data Analysis
Focuses primarily on examining existing data to answer questions, identify patterns and generate insights.
Data Analytics
Is a broader discipline that can include data collection, analysis, visualization, business intelligence, forecasting and decision-making.
Data Science
Typically goes deeper into programming, statistics, machine learning, predictive modelling and working with complex or large datasets.
If you are a beginner interested in becoming employable quickly, data analysis is an excellent starting point before progressing into more advanced analytics or data science.
Why Study Data Analysis at Inceptor Institute of Technology?
At Inceptor, the focus is not simply on learning software commands.
The objective is to teach you how to solve problems using data.
Training combines:
- Instructor-led classes
- Practical exercises
- Real-world datasets
- Excel analysis
- SQL
- Power BI
- Python
- Statistics
- AI-assisted analytics
- Portfolio projects
- Business case studies
- Career preparation
- Freelancing guidance
By completion, you should be able to demonstrate what you can do with data—not simply say that you completed a course.
Frequently Asked Questions About Data Analysis Training in Kenya
Which data analysis course is best for beginners in Kenya?
A good beginner data analysis course should combine practical training in Excel, SQL, Power BI, data visualization and basic statistics. Learning Python can further expand your analytical abilities. Practical projects are especially important because they help you build evidence of your skills.
How long does it take to learn data analysis?
The Inceptor short course runs for 3 months. However, becoming highly competent requires continued practice and building additional projects after completing formal training.
How much is the Data Analysis Course at Inceptor?
The 3-month Data Analysis Course costs KSh 60,000.
Can I learn data analysis without coding?
Yes. You can begin with Excel and Power BI without extensive programming knowledge. Learning SQL and Python later significantly expands the types of data you can work with.
Do I need advanced mathematics?
No. Basic mathematics is sufficient to begin. You will progressively learn the statistical concepts needed to interpret data.
Is Python necessary for a data analyst?
Not every entry-level role requires Python, but Python is valuable for data cleaning, automation, exploratory analysis and working with larger datasets.
Should I learn Excel, SQL or Power BI first?
For many beginners, a practical progression is:
Excel → SQL → Power BI → Python.
Excel introduces data manipulation, SQL teaches you how to retrieve information from databases, Power BI develops visualization and business intelligence skills, and Python expands your ability to automate and perform more advanced analysis.
Is data analysis marketable in Kenya?
Data analysis skills can be applied across banking, NGOs, telecommunications, healthcare, retail, finance, marketing, government, education, e-commerce, logistics and many other industries.
Your employability will depend on your practical skills, portfolio, experience and the requirements of individual employers.
Can I work remotely as a data analyst?
Some data analysis and business intelligence roles can be performed remotely. Analysts can also offer independent services including Excel analysis, dashboard development, SQL reporting and data visualization.
What should I have after completing the course?
Aim to leave with more than a certificate.
You should have practical projects demonstrating skills in:
Excel + SQL + Power BI + Python + Data Visualization + AI-Assisted Analysis
That portfolio can help you demonstrate your capabilities to employers and clients.
Start Your Data Analysis Career at Inceptor
Every day, organisations generate enormous amounts of information.
But data alone has limited value.
The opportunity is for people who know how to transform:
DATA → INSIGHTS → DECISIONS
Whether your goal is to get a data analyst job, improve your current career, become better at analysing business information, work remotely or provide freelance data services, practical data analysis skills can give you a strong foundation.
Don’t Just Learn Data Analysis. Learn How to Use Data to Solve Real Problems.
Enrol for Data Analysis Training at Inceptor Institute of Technology.
📍 Location: Hazina Towers, 18th Floor, Utalii Lane, Nairobi
💻 Study Mode: Physical & Online Classes
⏱️ Duration: 3 Months
💰 Training Fee: KSh 60,000
📞 Call/WhatsApp: +254 728 456 781
Intakes are ongoing. Start building practical, job-ready data skills today.
Learn More about the more Advanced Data Science Course
Take the wheel of the internet magic!! Get ahead of technology and be the driver of data-driven insights.
Contact us or visit our website to complete your Data Analysis Course registration process. Don’t miss the opportunity to master data analysis and unlock a world of possibilities!
For inquiries, you can reach us at (254) 0728456781 or visit us in person at our Nairobi location:
Hazina Towers, 18th floor, Utalii Lane, opposite Anniversary Towers.

You might be interested in
